Object Classification and Counting🔗
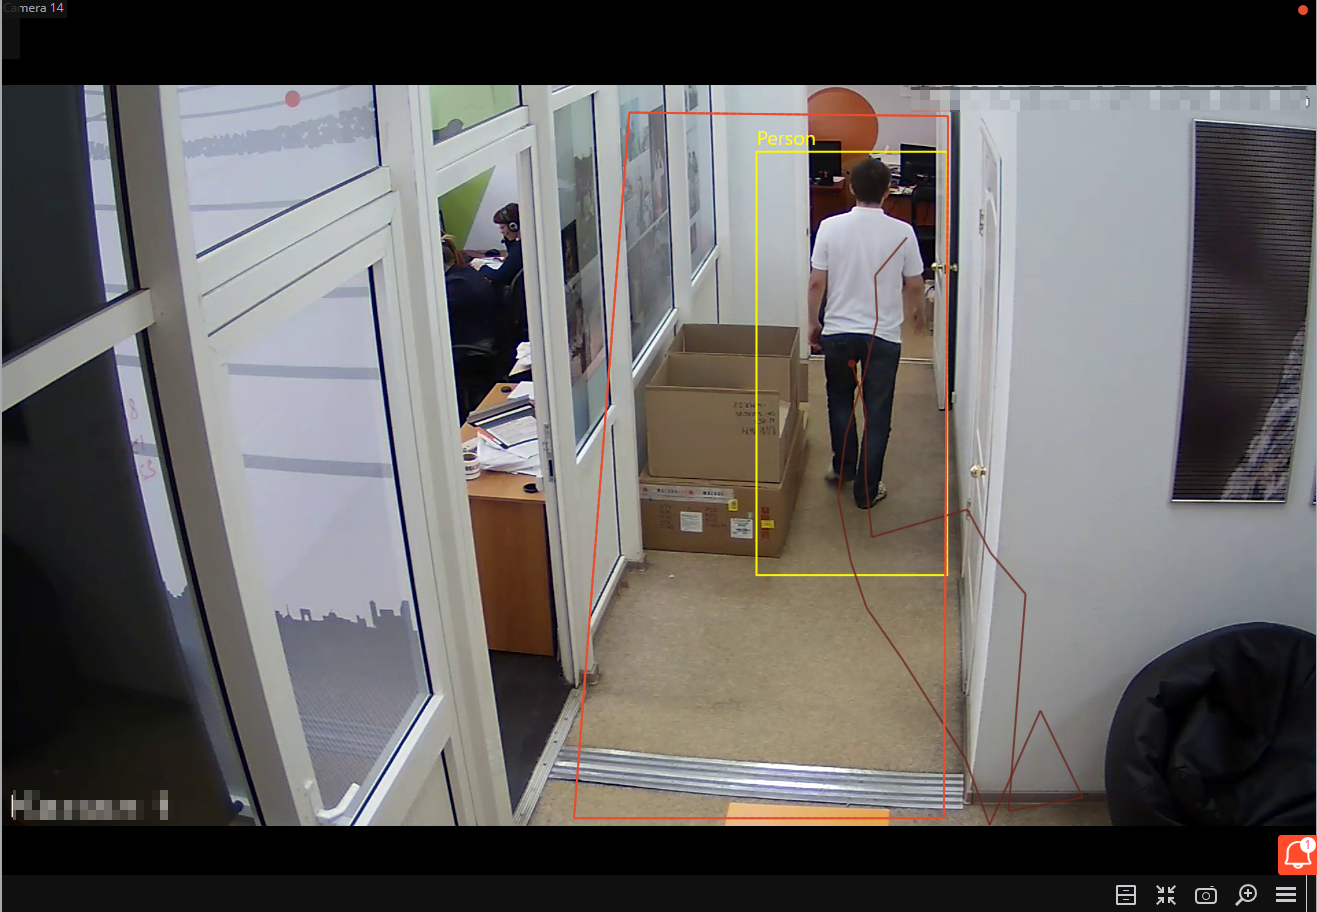
The Object Classification and Counting counts objects that are crossing specified lines or contained in predefined areas of arbitrary shape, distinguishing them by categories.
Warning
This module will only work on the cameras on which it has been enabled by the administrator of video surveillance system.
Live view🔗
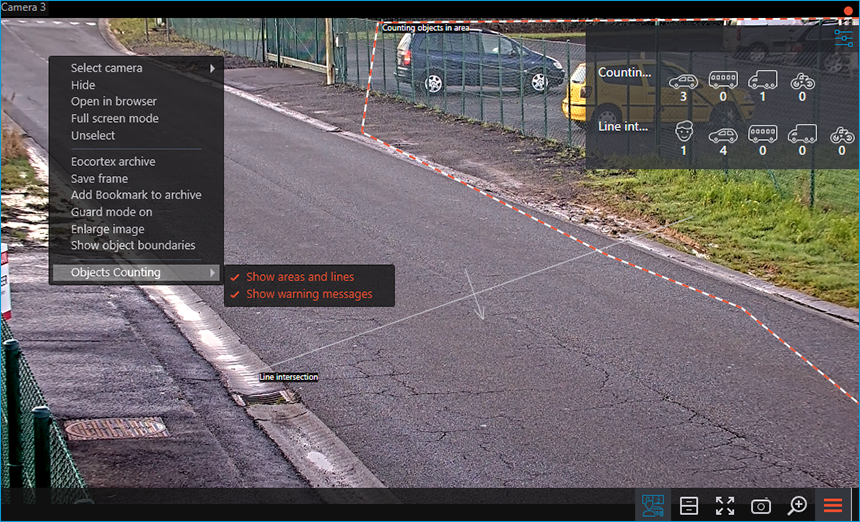
When viewing the camera in live view, it is possible to enable displaying of the object count panel. To do this, select a cell and click  .
.
Clicking  opens a window for configuring the display of areas and lines.

Displaying of areas, lines, and notifications can also be enabled in the context menu of the cell.
"Object Classification and Counting" report🔗
The representation of the Object Classification and Counting report depends on the type of counting:
Counting objects in area: The count of objects within the area.
Line intersection: The count of objects that crossed the line in a specified direction. The following parameters will be displayed:
Total count of objects: Objects that have crossed the line since the start of counting or since the last time the counters were reset.
Change in the number of objects: Objects that have crossed the line at each time interval equal to the report plotting step.
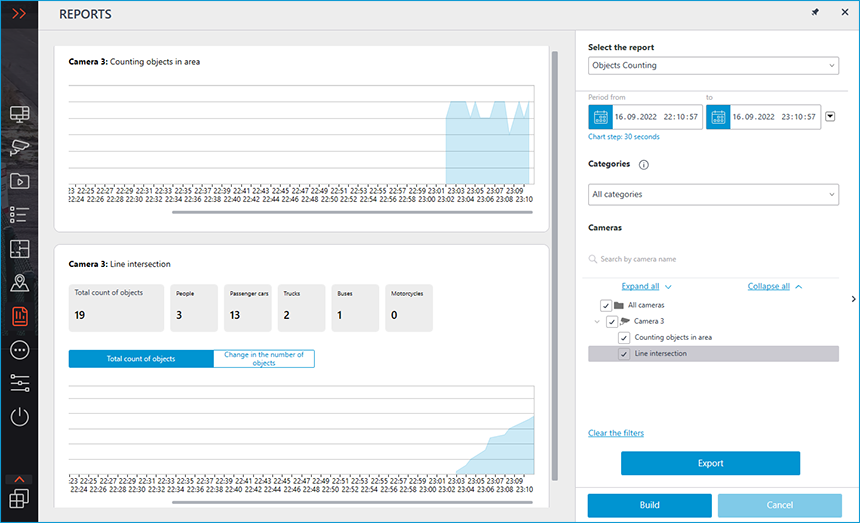
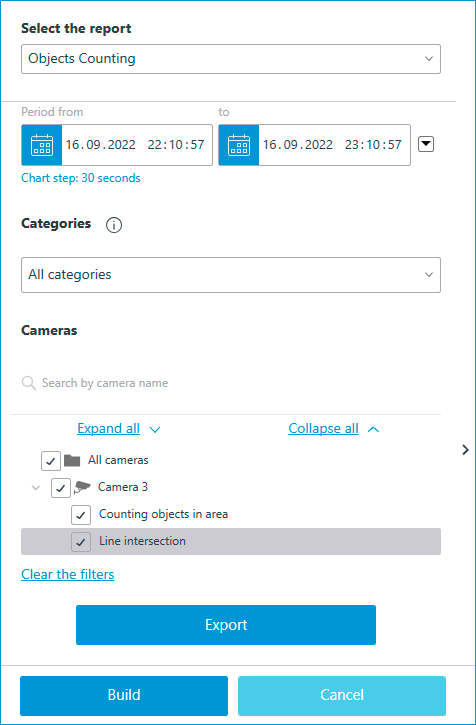
To form a report set the time interval, select categories of objects, areas and lines, for which the report will be built, and then click Build.
Warning
The report generation start time mustn't coincide with the counter reset time. The counter is specified when setting up the module, contact your administrator for information on the module.
Note
Plotting step is determined automatically depending on the set time interval:
Interval |
Step |
|---|---|
Up to 1 hour |
30 seconds |
From 1 to 2 hours |
1 minute |
From 2 to 10 hours |
5 minutes |
From 10 to 20 hours |
10 minutes |
From 20 hours to 2 days |
30 minutes |
From 2 to 4 days |
1 hour |
From 4 days to 2 months |
12 hours |
From 2 to 4 months |
1 day |
From 4 months to 1 year |
3 days |
More than 1 year |
1 week |
Note
Maximum allowable interval for plotting the report is 2 years.
The report can be exported as a CSV or Excel file.
Related references🔗
Configuring the Object Classification and Counting module
Requirements and recommendations for the Object Classification and Counting module
Installation and update of the Object Classification and Counting module