Traffic Density Heat Map🔗
The heat map module is designed to visualize the traffic density in various areas of the frame. A heat map is formed by summing up the time during which a movement was observed in a certain point — as a result the areas where objects stay more often and for the longest time are highlighted.
A color scale is used to visualize the traffic density: areas are overlaid with transparent color stains according to the traffic density in a video image. For example, if you use a four-color scale, red color denotes high density areas, blue — low density; green and yellow colors are transient.
The heat map module can be used to determine the popularity of different places (racks, cabinets) in a store, preferred routes for people or vehicles, as well as to analyze visit statistics of various objects.
There are three options for using heat maps: real-time mode, scheduled report and camera field of view overlaid on an object plan. In the real-time mode only areas with movement for the last 10 seconds are displayed in the frame. The scheduled report sets the interval of time used to analyze traffic density in the frame. Camera field of view overlaid allows creating a heat map not only in the frame but also on an object plan.
Warning
This module will only work on the cameras on which it has been enabled by the administrator of video surveillance system.
Warning
Displaying heat maps on plans is not supported in the GNU/Linux family operating systems.
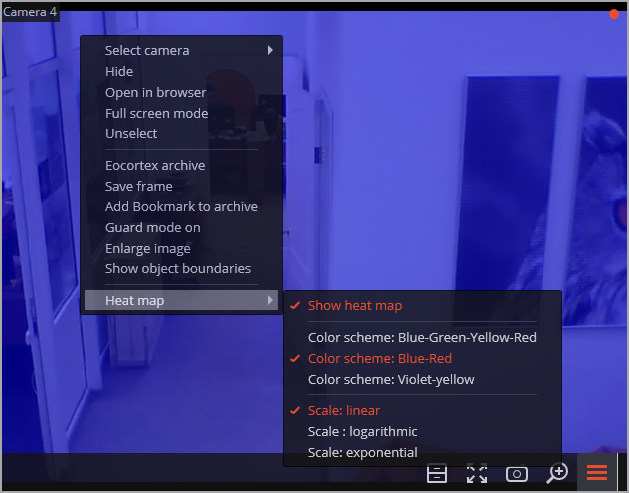
To enable in the context menu of the cell you need to open the submenu Heat map and select Show heat map item. Also in this submenu you can specify the scale and color scheme of the heat map.
"Heat map" report🔗
To create reports, select the Reports item in the main menu.
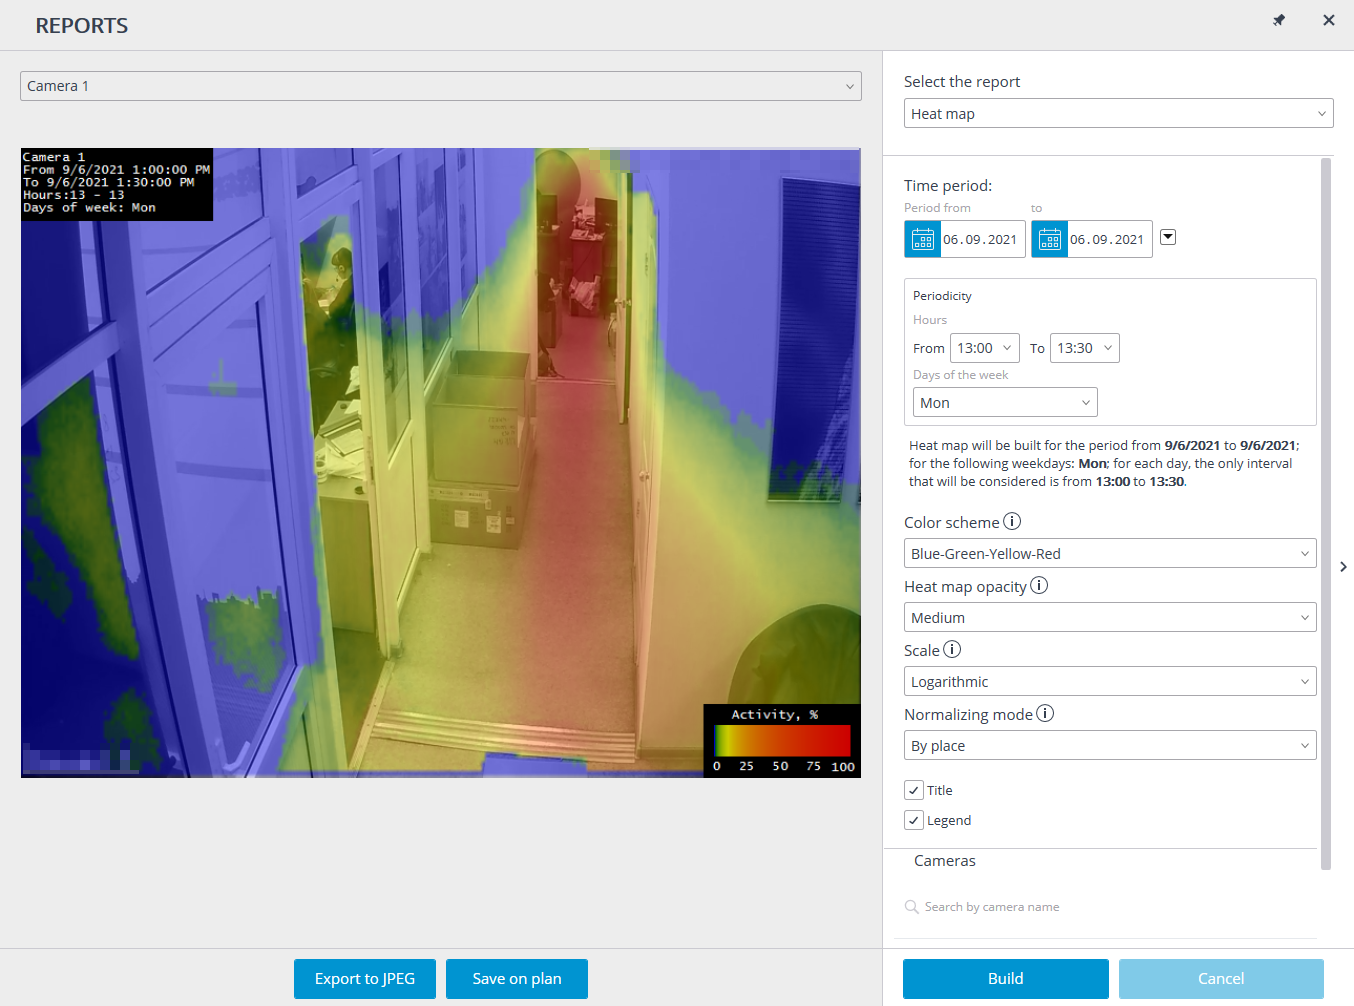
In Select the report field, select the Heat map.
Set the Time period for which the report will be generated. Also, in the field with the list you can indicate an interval before the current time for which a report shall be generated. To do that, you will need to select one of the following: Minute, Hour, Day, Week, Month.
Choose Cameras, Scale, and Normalizing mode.
Select Cameras and zones for which the report will be created.
Additionally, the following parameters are available to report generation:
Periodicity: allows to set Hours and Days of week during which the motion in the frame will be counted. The weekdays can be selected by ticking boxes in the pop-up menu.
Color scheme: allows to select color scheme for showing activity values on heat map. Similar activity values have the same color.
Heat map opacity: allows to set heat map opacity. The higher the opacity - the easier it is to see the background.
Scale: toggles the color scale to non-linear Header which displays the following in the upper left corner of the heat map: camera name, interval, weekdays and hours used for creating a heat map.
Normalizing mode: determines how the maximum density value will be determined in each point on the heat map.
Title: is the text displayed in the lower right corner of the heat map.
Legend: displays a legend in the lower right corner of the heat map which matches the scale colors with the levels of movement density.
To generate a report, click Build. To abort, click Cancel.
After generating the report, the Visualize heat map for the given period of time scale will appear. It allows to review the reports for the shorter periods of time within the generated report.
To save the report to a disc, press Export to JPEG. In the opened window choose a location where to save the report and press Save.
Save on plan button allows to upload the file with heat map images superimposed on the corresponding cameras’ fields of view on the plan to a disc.
Related references🔗
Configuring the Traffic density heat map module
Requirements and recommendations for the Traffic density heat map module